Monday, December 20, 2010

FTSE

What is going in Britin reflects on DJI..

Is FTSE respecting resistance?


I apologize of stopped which is against my willing .. I try to be close to follow the posts that need to closely watching.)

Thursday, December 16, 2010

NFLX

Another intersting stock, deserve to watch it closely


Today the stock trading near 235$

Wednesday, December 8, 2010

MMM

intersting stock


the target has been achieved

Wednesday, November 17, 2010

DRYS

Stock is soaring ...


DRYS broke the resistance and now retest the it again


Saturday, November 13, 2010

Gold

Gold shows a profitable perfomance, but how long to holding ?


technically, there is a bearish divergence forming. i think its a early cuation of disaster.

Monday, November 8, 2010

BIDU

I think BIDU have a good surprise for bulls.

Friday, October 29, 2010

AAPL


8Dec.


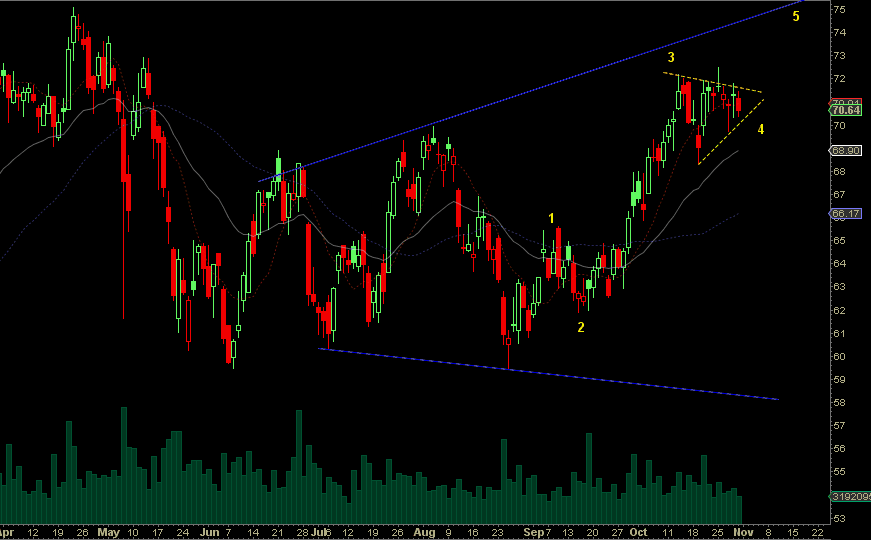
AAPL is about to change trend after spent long time is range trend phase


20 Nov.


Last update I showed a good continuation chart pattern on AAPL chart, today stock achieve targets og rhat pattern.


Currently AAPL about to form another pattern but reversal one called reverse head and shoulders as shown.


*******************


29 Oct.


market shows little bit choppy, there arent any signal of decline at this moment. But i like whats AAPL doing now, as long as it soaring there are many chart patterns on the way.


Monday, October 18, 2010

DE


17 Nov.


is it pullback or falling?


*****************


The chart is very clear that stock forming a rising wedge, inaddition run and bump pattern has been forming. I think its a good opportunity for short stock when its show a good signal.


Friday, October 8, 2010

BA


17 Nov.


It was a dramatic decline, actually it was a surprise for me becouse I thought stock will go up..


now stock has a major support near 60$


5 Nov.


After many days of trading, the BA shows a good setup as shart showing.


Here we are again. BA showing a good impulse wave setup, and wave 4 is triangle very clear, I think need 1 more jump to complete this impulse wave.


Also a broadening pattern concur with above view, so the stock have room for jump to 75.


16 0ct.


The resistance has been penetrating, Although the momentum is not showing a impressive performance. I Think we should wait for confirm The penetrating by not price moving below a new support.


BA reach to a solid resistance, I consider it a good entry for short a stock.But let wait next week action.


Sunday, October 3, 2010

Apologize

i apologize to readers for didnt update post or even didnt post new one, becouse I've registered in high graduated study in some colleges. From now Iam going to check this blog weekly untill finish my thesis. good luck

Tuesday, September 14, 2010

HON

16 Oct.

Loss deal


22 Sep.


The stock takes a Long time to act Like what I was predict. I admit I have bothered from price action


and I admit That is so difficult To use or combine many technical school To reach a one possible result, HON give me good example as You can see the stock penetrates a resistance near 43-44$, by applying technical analysis rules, the Traders should buy This stock. On another hand, when try to apply EWP, The opposite action Should be taken (short) as showing on Chart. Sometimes I ignore EWP especially when technical analysis Shows a good signal supported with high volume, fortunately that doesn't apply on HON.


I have been waiting this stock since it was in bottom, and have a confident it will return to current prices. I might it a good chance to short stock or buy PUT option for OCT. strike 43, the target is preceding bottom. and stoploss will be announced next updating.


UPDATE


sell oct. and buy nov. same strike


60 min chart


Iam buying PUT option strike 43 Oct. before close.


Tuesday, September 7, 2010

WDC


************
16 Sep.


Stock in the way to fall. stoploss is 28$


*********


7Sep.


Short setup on WDC stock, its in bearish trend for long time. Stock close above 30EMA and below 50MA. Volume is decreasing.


Iam going to buy PUT option strike 26 Oct, my target is 23$ and stoploss is close above 50MA with huge volume.


Good luck


Wednesday, September 1, 2010

IWM


11 Sep.

The counting in RUT is differ than other indices, I think it still in wave 2 and it hasn't completed yet, actually I see there is a good opportunity to buy IWM for very short term next week.


60 min chart.


**********
7 sep


chart shows a resistance and support of russel 2000.


***********


1Sep


markets are receiving September with a huge gain. The counting below needs to recounting one more maybe in weekend.


********************


31Aug


IWM is russel 2000 ishares its good when you want to chasing the russel index. I think there a room for falling this week.

I will put this post in updating group.


Wednesday, August 25, 2010

ANF .. long term view

7Sep


althought the soaring indices in last week, The ANF didnt act the same way. Soon or later ANF will complete the H&S and it is going to fall to 30$ as I expected, stoploss is 37.7$.


Good luck


***********


2Sep.


After earning had released last week, the stock dropped more than 4%. Now stock makes a small consolidation which seem a flag.Meanwhile, in long term, rhe stock is forming a huge head and shoulders.


Strategy is short or buy a PUT or even sell CALL for strike 35 OCt.

Target is 30$


Wednesday, August 18, 2010

OIH


10 Sep


updating OIH, as shown on chart, prices near to resistance and try to retest the broken trend. Ithink its time to sell oil.


*********


18 Aug


OIH is oil service holders and moving with oil price consistently. you could buy and sell OIH depend on you opinion of oil.

The chart of OIH shows the 2 probably pattern a ascending triangle and a bearish wedge. The third chart is a 15 min frame, it shows the bearish counting.


ascending triangle (see details on chart)


bearish wedge


bearish counting


all possible patterns or counting are need more time to confirm which direction OIH will heading.

Three reasons to short CLF


14 Sep.


CLF is about to forming a top, also on 60 chart CLF building a top broadening wedge, in addition counting shows that stock might form a last top to completing the wave.


***********


10 Sep


stock forms a lower higher near 78.6% fibo resistance, what is good thing on chart is a bearish engulfing pattern. this candle pattern has been formed exactly below 78.6% fibbo and touched blue upper trend of broadening wedge, that concurs with a general bearish view on stock. In addition , the gap as showing stills open and act as support.


*********


31Aug


The bearish situation didnt change, every stocks shows a weak signal.


********


21 Aug


Next week will be big bang :)


*****************


17 Aug


CLF is needless to identify, common in basic material sector. technically, stock shows a good opportunity for short it or buy PUT option.


The main support is near 58$


Monday, August 16, 2010

$WTIC ... oil continuous contract


23 sep.


There are two chart patterns are spotted. tinstone is a head and shoulders, and second is a huge flag. both Patterns are a bearish. 67 $ look like a good support.


14 Sep.


Oil completed the wave ( 2 ) as showing on chart, wave ( 3 ) might starts near from this area.


*************

11 Sep.


Daily chart of oil show a complex correction wave. the last rise leg about to completing, next week will be crucial.


**********

7 Sep.


OIL still in trading range movement. In EW perspective, oil moving as a correction wave, see chart. I think oil has room for advancing.


***********


30 Aug


Oil trading near to lower trend of rising channel as shown on chart. To predict the oil price movement I use many charts such as $WTIC, USO, OIH and some giant companies that relating to oil fields, I use all of them to get a clear view of next step of oil prices, but now as showing on chart of oil, its clearly that oil seems to retest the lower trend of channel before falling to next support near to 77$ then 66.6$.


best wishes


*********


18 Aug


Here a chart of OILUSD. the decline was a five waves so the oil will bounce as a correction wave either 2 or b and target is wave 4 in preceding wave.Iam interesting about USO,it reflects the oil movement.


16 Aug


$WTIC is oil prices with continuous contract, we will use it when we try to analysis the oil in general. Technically, oil still plays in uptrend channel as shown, waiting for breaking it or rebound to upper trend.


watching closely ..


Sunday, August 15, 2010

EUR/USD


13 Nov.


Will USD return back to the golden age?


11 Sep.


There are two possibles count of eurusd, as showing on chart.


No decision is taken untill picture completed.


**************


8Sep


USD forming a flat, actually it in wave c as showing. I think its good opportunity to buy it and sell near previous high.


UPDATING: target achieved


********


1Sep


USD showing a good rally today. In short term I hesitate where should $ will go but in long term Iam bullish $ and bearish euro.. so lets see some chart which may gives a some signals.


first chart is a long term analysis


second is short term


currently USD forming a impulse wave


************


30 Aug


Dollar shows a confuse count, its better to wait until a good signal appears.


********


17 Aug


Its clear that the decline from top of 6 Aug was a five waves as I showed in previous post. Now the EURUSD retrace as a three waves either a complete 2 wave or just A wave.


*************


15 Aug


This post is for analysis EURUSD currency, I make it in right upper part of blog to be in prominent place that anyone can see it.


So euro seem losing it strength and it is returning to follow the decline trend. the decline was as five waves, but has it finished or yet? we will find answer in following days.


( right click then open in new window to show original size)