Friday, May 21, 2010

DJI short term

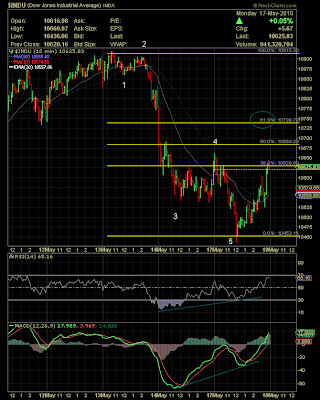
In this post i will follow dow movement by analysis of ( DIA).


i thnk will see a more decline monday.


24 May


i think there are a last decline as a fifth wave.


27 May


as i predicted before, dji completed a wave 1 or b whatever, now target is 62% , and waiting penetrating a nickline.


2 Jun


i think will see more decline to 9900 as a wave B then small rally to 10200


3 Jun


Dji almost reach to 10000 which was wave b, now wave c is running, its estimated goal near to 62% = 104,7


4 Jun


bearish wedge, dji heading to 9800 


9 Jun


dji is moving as i expected before, now its near 9800 which is a support area (see above chart)

regardless of a short term bullish counting, i think dow will move to a resistance area near 10300

maybe today or next week will see this prices of dji.


16 Jun


That what i excepted to happen. First will see little decline then advance as a c wave 


Wednesday, May 19, 2010

AXP


AXP 


watch it!!


20 May 


i think fifth wave will be a diagonal, next week should see big advance. still watching..


CLF another stock deserve to buy it


chart of CLF is similar to DO both are near to completed 5 wave down and should corrected in rally take price to precede fourth wave.

watching 52.5 call jun price near 3$ 

good luck


22 May


Finally,the picture of this stock completed, now is very easy to notice five impulse wave structure, stock should rally to its target as a 2 wave ( zigzag or flat).

wave 1 started 15 April and end 21 May ( 27 trading day ), i guess 2 wave will spend short time comparing with 1 wave.

If u care about candlestick u can see a engulfing bullish.


jun 52 call is next big deal. ( price = 3.15 )


27 May

jun 52 call now 6.65$ more than 100% gain ... thank to god.

Monday, May 17, 2010

DO


Regardless of a fundamental analysis, the stock is give a typical formation of elliott wave with me during many years, its easy to see subdivision of wave.


in hourly chart five waves almost done, which it is a 3 wave acoording to daily chart, the plan now to watch this stock an ride it in rally 


18 May


As showing in daily chart, the stock form a hammer candlestick which is the second candlestick indicate that decline reach to support ( the first candle was a doji), i guess we finish a decline as a impulse wave whatever it was, we should see rally in price near future. for details see chart.

june 71.75 call is next deal.


19 May 


still we tracing DO movement, i think the stock in last stage om movement before advancing to 73$ then to 76$ dollar. i built my opinion depend on elliott wave principle.


i will buy upon call option when the time be suitable.

DJI in long term analysis


that what i believe about dow in long term, its exactly what prechter predicted for dow.


so hope be useful to know the next major trend so u can build u strategies depend on it.


18 May


dji in 10 min,  i see dji will reach to 62% ... keep watching

Tuesday, May 11, 2010

chasing SWC


as shown, the stock dropped nicely in 3 wave whatever its correction or impulse, we will chasing it untill get a pure view. Actually i prefer a impulse wave pattern in order that wave 4 dont overlap with wave 1.


12 May

overlap between 1 & 4, waiting a few days to ensure that impulse pattern rejected.

Tuesday, May 4, 2010

should we trading a penny stocks?

Always i ask my self , does penny stock deserve to trading with it? does a technical analysis applying in penny stox?


first let see CRXX, this stock forming a small triangle pattern


I think there some penny stocks comply with technical analysis rules, from that i add FNM to my wacthlist