6 Oct.
After long time patienting , the dji reachs to a major resistance which is last resistance if I consider the wave 2 is underway, so its good opprotunity to short depending on bearish count. definitely the stoploss will be 11250 which is a previous top, good luck.

**************
23 Sep.
After waiting longtime, The bullish trend has been crazed which began in late of August.. In few coming days Dji may retrace to next support.

weekly chart of Dji.
11 Sep.
60 min chart of DJI shows a rising wedge pattern that mean the uptrend started to be weak.
UPDATING...14Sep.
DJI rose yesterday and rising wedge be invalid technically however SJI still in bearish mood according on EWP and technical analysis.
************
7Sep.
I was busy this weekend and I apologize to readers for tardiness of updating. Iam ignoring the Elliott wave analysis in next updating for many reasons, first one is in correction waves the precision of EWP going to be less than in impulse wave and sometimes give a deadly signal for traders.Secondly, In correction wave there are many scenario for next move and that make you decision so difficult. For a above reasons I don't use EWP in correction market (trading range market). I will use only EWP in very short term frame such as 15 min and less as a my . In another hand Iam going to depend on indicators, candlesticks and patterns.
Now, lets see chart of DJI, its so difficult to guess where it heading.

and chart DJI in 60 min, the DJI started a new powerful trend
so I expect the preceding fall is a correction .

***********
2Sep.
To be honest I started to doubt if market really going to fall according to what elliotticans said!. That not strange because the EWP depends on eliminate the other counting to get best one, but when other counting are still possible that makes any decision you will do it as a big fool, so you need put all possible counting in table and discussing every one then eliminate any one doesn't show any relating to the real movement of markets.By this procedure, you able to predict the next move.

So lets see what we have.I think we have bullish and bearish counting, and they sharing same percent 50% for each other when we related it to markets movement.
************
30 Aug
In The prior post I mentioned that dji is about to falls. Now dji bounces as a wave 4 which should not rise above 10220 to consider it a wave 4.
In opposite opinion, dji shows a double bottom as shown in 15 min chart,so be careful.
*************
18 Aug
The Dji almost near to completing the wave 2
************
15 Aug
The last three days were hard to market, in despite it was predicted. So, all trades will be short or PUT options consistently with market behavior.
Lets see DJI in 60 min, notice the broken trend and the declines with 4 subminor waves..
Technically, always I heard story about broken trend that prices should retest that broken trend but I supose prices should at least retrace 62% from top to bottom which is going to form.
10 Aug
I think this count is more acceptable to me because still DJI got momentum.
9 Aug
I think the counting in previous chart need to recount, I will do it in mid of next week. What a intersting thing i found it in DJI is broading wedge formed, as shown in chart above.In my opinion, DJI have room for rising next week.
broading wedge and adam bar are agree with this view.
***********
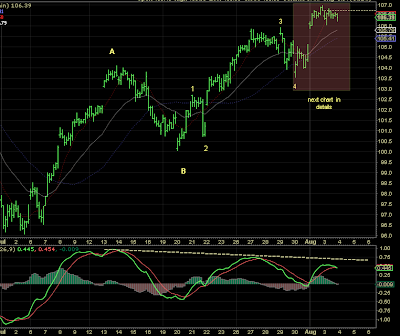
4 Aug
DJI touch 10700 intraday and close below it. The last update i mentioned that DJI need one more advance to complete a wave C of wave 2. Did DJI completing wave 2 or yet?
that question rise on my head all day, therefore i put 2 scenario which are all bearish but the difference is where wave iv formed. see charts
##########
29 Jul
Here a new update, we almost finish C wave of 2 wave, we will watch DJI closely.
27 Jul
DJI is away 30 point from 62% retracement resistance, which is a previous high.
today close was a small body candle. I think DJI didn't give a clear signal to decide if a wave 2 completed or not. Tomorrow will give us a good information.
see yeah
26 Jul
http://ta7aleel.blogspot.com/2010/07/dji-br-elliotican-perspective.html
The link above was a try of count the DJI, today i make some change in counting as showing in chart below.
The new counting is suiting the count of gold as i mentioned in previous post.
reach DJI to 11,000 area is less likely, but if its happen, i will suppose the reason is a reverse head and shoulder ( not shown in chart ).
I am out, my plan is catch ending a 2 wave which is start of 3 wave . Good luck


No comments:
Post a Comment